
Measuring Biological Alpha


Nine out of ten drug programs entering clinical translation fail. A critical failure mode traces back to the fundamental decision of target selection. By nature, that decision gets made early, in an environment of high uncertainty.
Today, a wealth of assays and experimental methods producing data on biology is available at the stage of target selection: large-scale human biobanks, single-cell atlases and -perturbations, clinical and multi-omic data, as well as virtual simulations and foundation models.
But data does not equal information. Information is not distributed equally across data and petabytes of data can contain zero information on “will this drug work in humans” if not aligned with the problem.
Building evidence from data requires knowing what to look for and where to look. The problem is that for the vast majority of data available at the stage of target selection, we simply do not know how much relevant information it contains.
This leaves industry chasing after hype and running on beliefs. A model prediction on cell state change and an animal model readout are not the same as a clinical effect in real-world patients. Almost everyone in biopharma claims a better method to pick targets, but almost no one evaluates their methodology rationally against real-world clinical outcomes. This needs to change!
Jack Scannell coined the term predictive validity, to quantify the information an experiment provides on the outcome that it seeks to inform (“will this drug work in humans”). A 0.1 gain in predictive validity of pre-clinical experimentation can beat a hundredfold gain in throughput. This makes sense, as predictive validity is directly tied to risk, and failure rates. Reducing the failure rate in drug development is by far the most impactful lever on financial returns.1
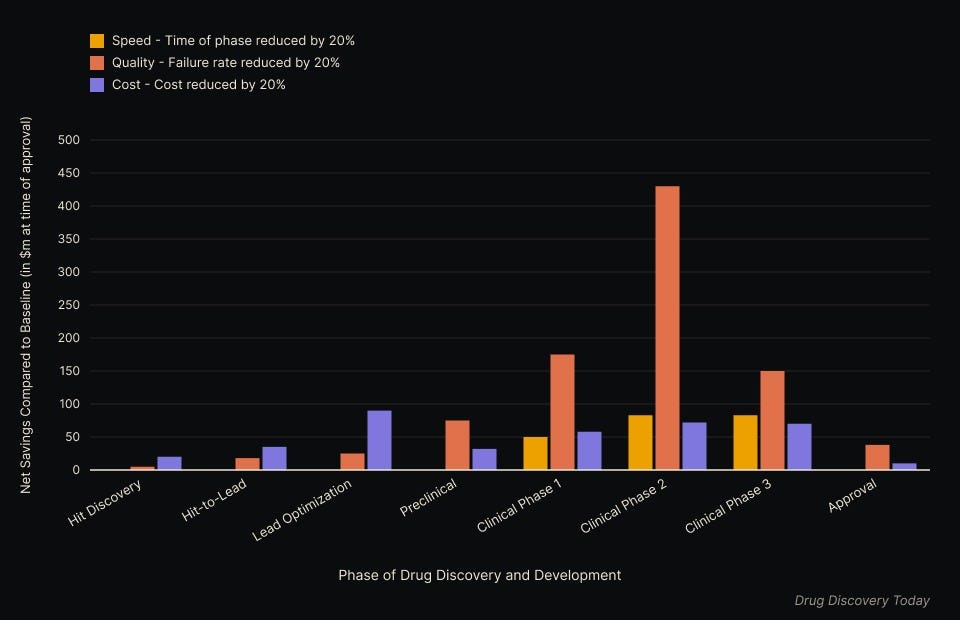
Pheiron exists to engineer biological alpha: knowing what works in humans early enough to change the outcome of a drug program (and avoid failure).2 Engineering biological alpha requires understanding the predictive validity of data assets, methods and evidence sources.
Every decision around data or methods ultimately comes down to the same question: how much can we expect this specific evidence source to lift the likelihood that this drug will succeed?
Benchmarking that lift is the foundation decision making at Pheiron runs on.
Benchmarking data to quantify evidence
At Pheiron, we take a systematic approach to quantifying the actual P(success) lift we can expect from including a specific evidence source in our decision. Our platform connects data assets and methods for evidence generation directly and reproducibly to quantitative metrics of clinical trial success. Importantly we do this systematically across broad categories, from large-scale human biobanks and human genetic evidence over pre-clinical experiments (like expression or perturbation screens on tissue and cell level), to information on pathway biology, literature, clinical precedent, all the way to in-silico predictions and foundation models.
One of the central evals we run for each data asset and source of evidence is a backtest quantifying Relative Success (RS). Across all historical drug programs with known outcomes, we compare drug programs that would have been supported by a specific type of evidence, with those that would have not. Relatively speaking, does having this evidence increase or decrease the ability to pick winners?
Systematically quantifying relative success allows us to understand how much decision enabling information we can expect a data asset or evidence source to contribute.
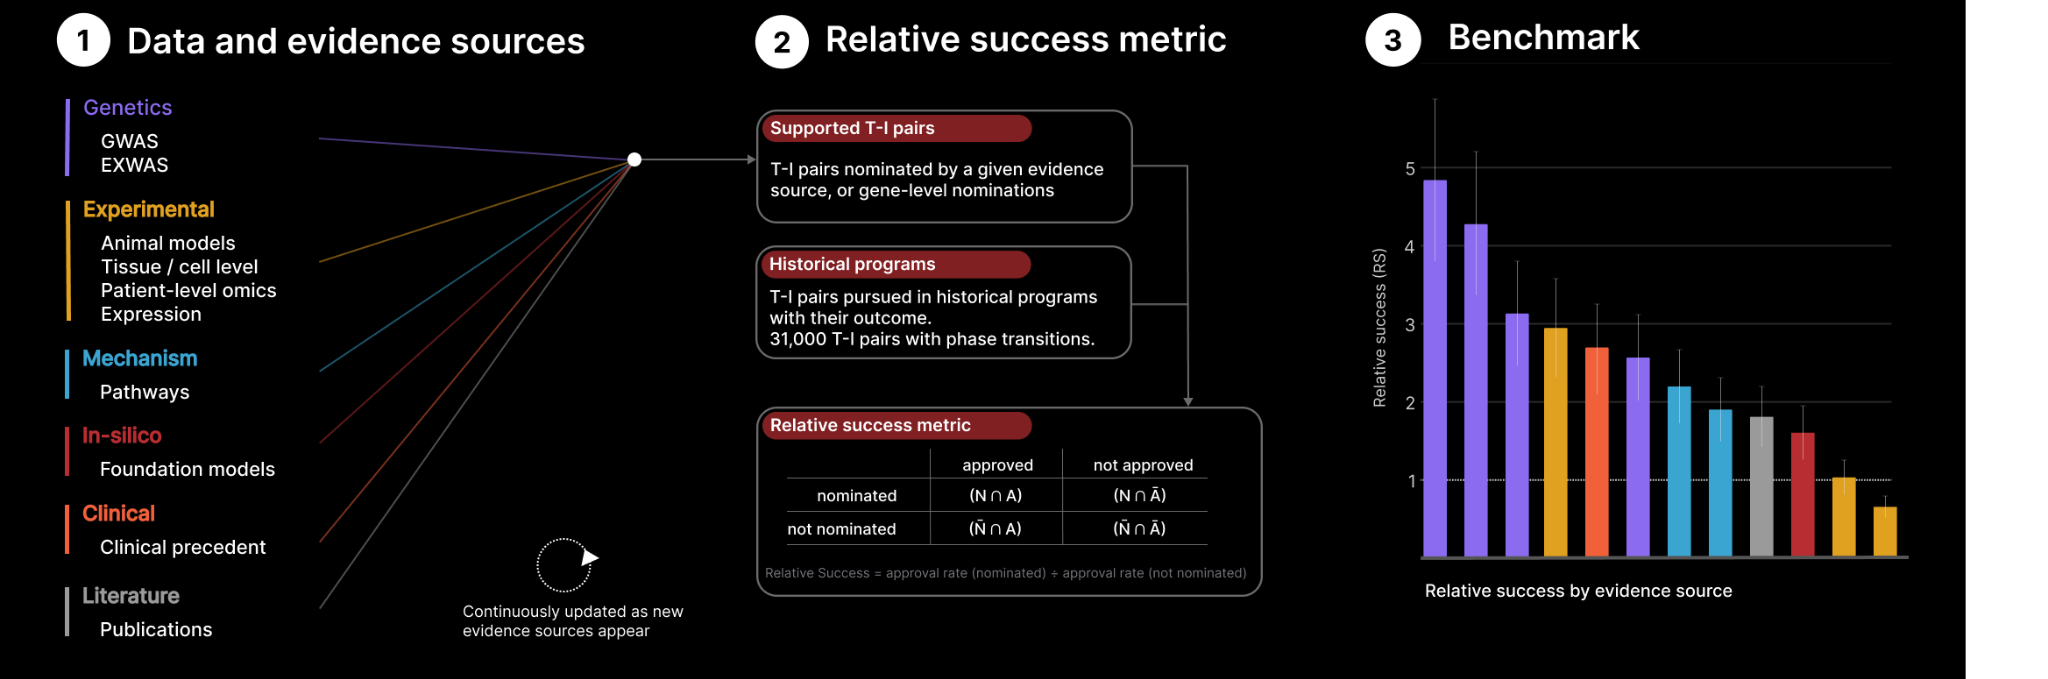
This data eval builds on the Relative Success metric used by Nelson, 2015 in their infamous paper demonstrating that targets with human genetic support have resulted in successful drugs about 2.6 times as often as targets without.3 Since its publication, billions of dollars have been invested based on this thesis.
But Relative Success is not limited to genetic evidence.
While gene to trait pairs, such as those identified by genome wide association studies or rare disease genetics can (somewhat) straightforwardly be mapped to target-indication (T-I) pairs pursued by drug programs, we apply a generalization of the Relative Success metric to evaluate any type of data asset, evidence source or method that can nominate targets (and, optionally, linked indications).
This unlocks systematic quantification of the expected decision enhancing information across our platform or, in other words, understanding what drives biological alpha.
Where is the alpha?
So which data assets, methods and evidence sources can be expected to increase clinical success?
To illustrate the point, we present a subset of the data and evidence sources integrated in our platform, spanning human genetics, gene expression and perturbation screens, information on pathway biology, literature, clinical precedent, and gene-level in-silico predictions and compare the Relative Success across 31,000 T-I pairs.
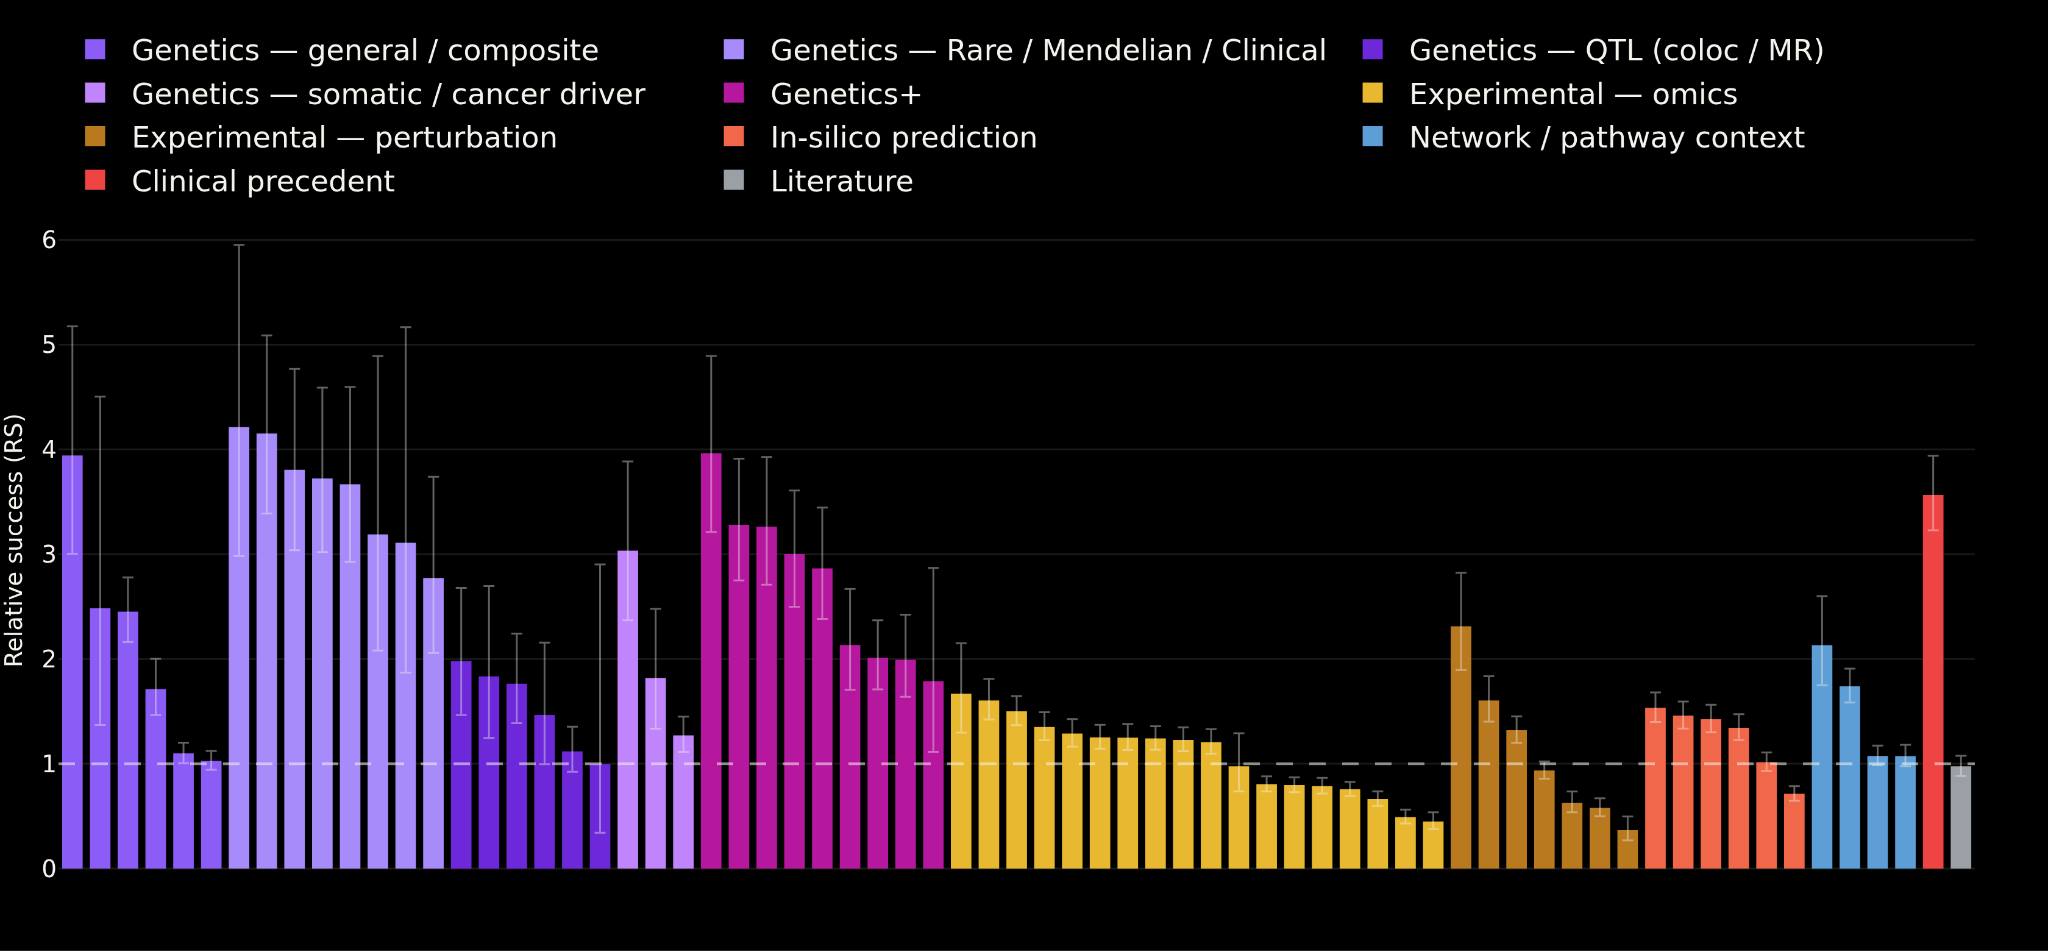
In this subset, genetic evidence shows the highest Relative Success. Within genetics, rare variant evidence has the highest enrichment of successful programs (RS around 3.5), whereas colocalization (genetic evidence linking molecular mechanisms and disease traits) nominates more, but less successful programs (RS around 1.8). That is slightly worse than some experimental resources that have a clear T-I specificity, like animal models (RS = 2.31). Interestingly, Gene-based features, such as broad expression, or large effects in perturbation screens are relatively depleted of successful programs (possibly because such targets have more side effects4).
Using the Relative Success metric, we see that the information we can expect varies dramatically across data assets and evidence sources. This should not come as a surprise. Knowing exactly from which data types and evidence sources we can expect relevant information for which therapeutic area or indication, is what lets us rationally identify biological alpha.
Integrating evidence to engineer biological alpha
Before we only measured. But measurement allows for engineering: building on this and other data evals, we can engineer favorable combinations of evidence sources to maximize the expected lift on clinical success rates.
Let’s walk through an example: Before we’ve seen that simple features like a target gene’s general expression profile can have a measurable impact on RS. In a recent pre-print, the OpenTargets consortium5 showed that pleiotropy (the number of traits a gene can be linked to) can be combined with genetic evidence to construct an evidence source with superior relative success.
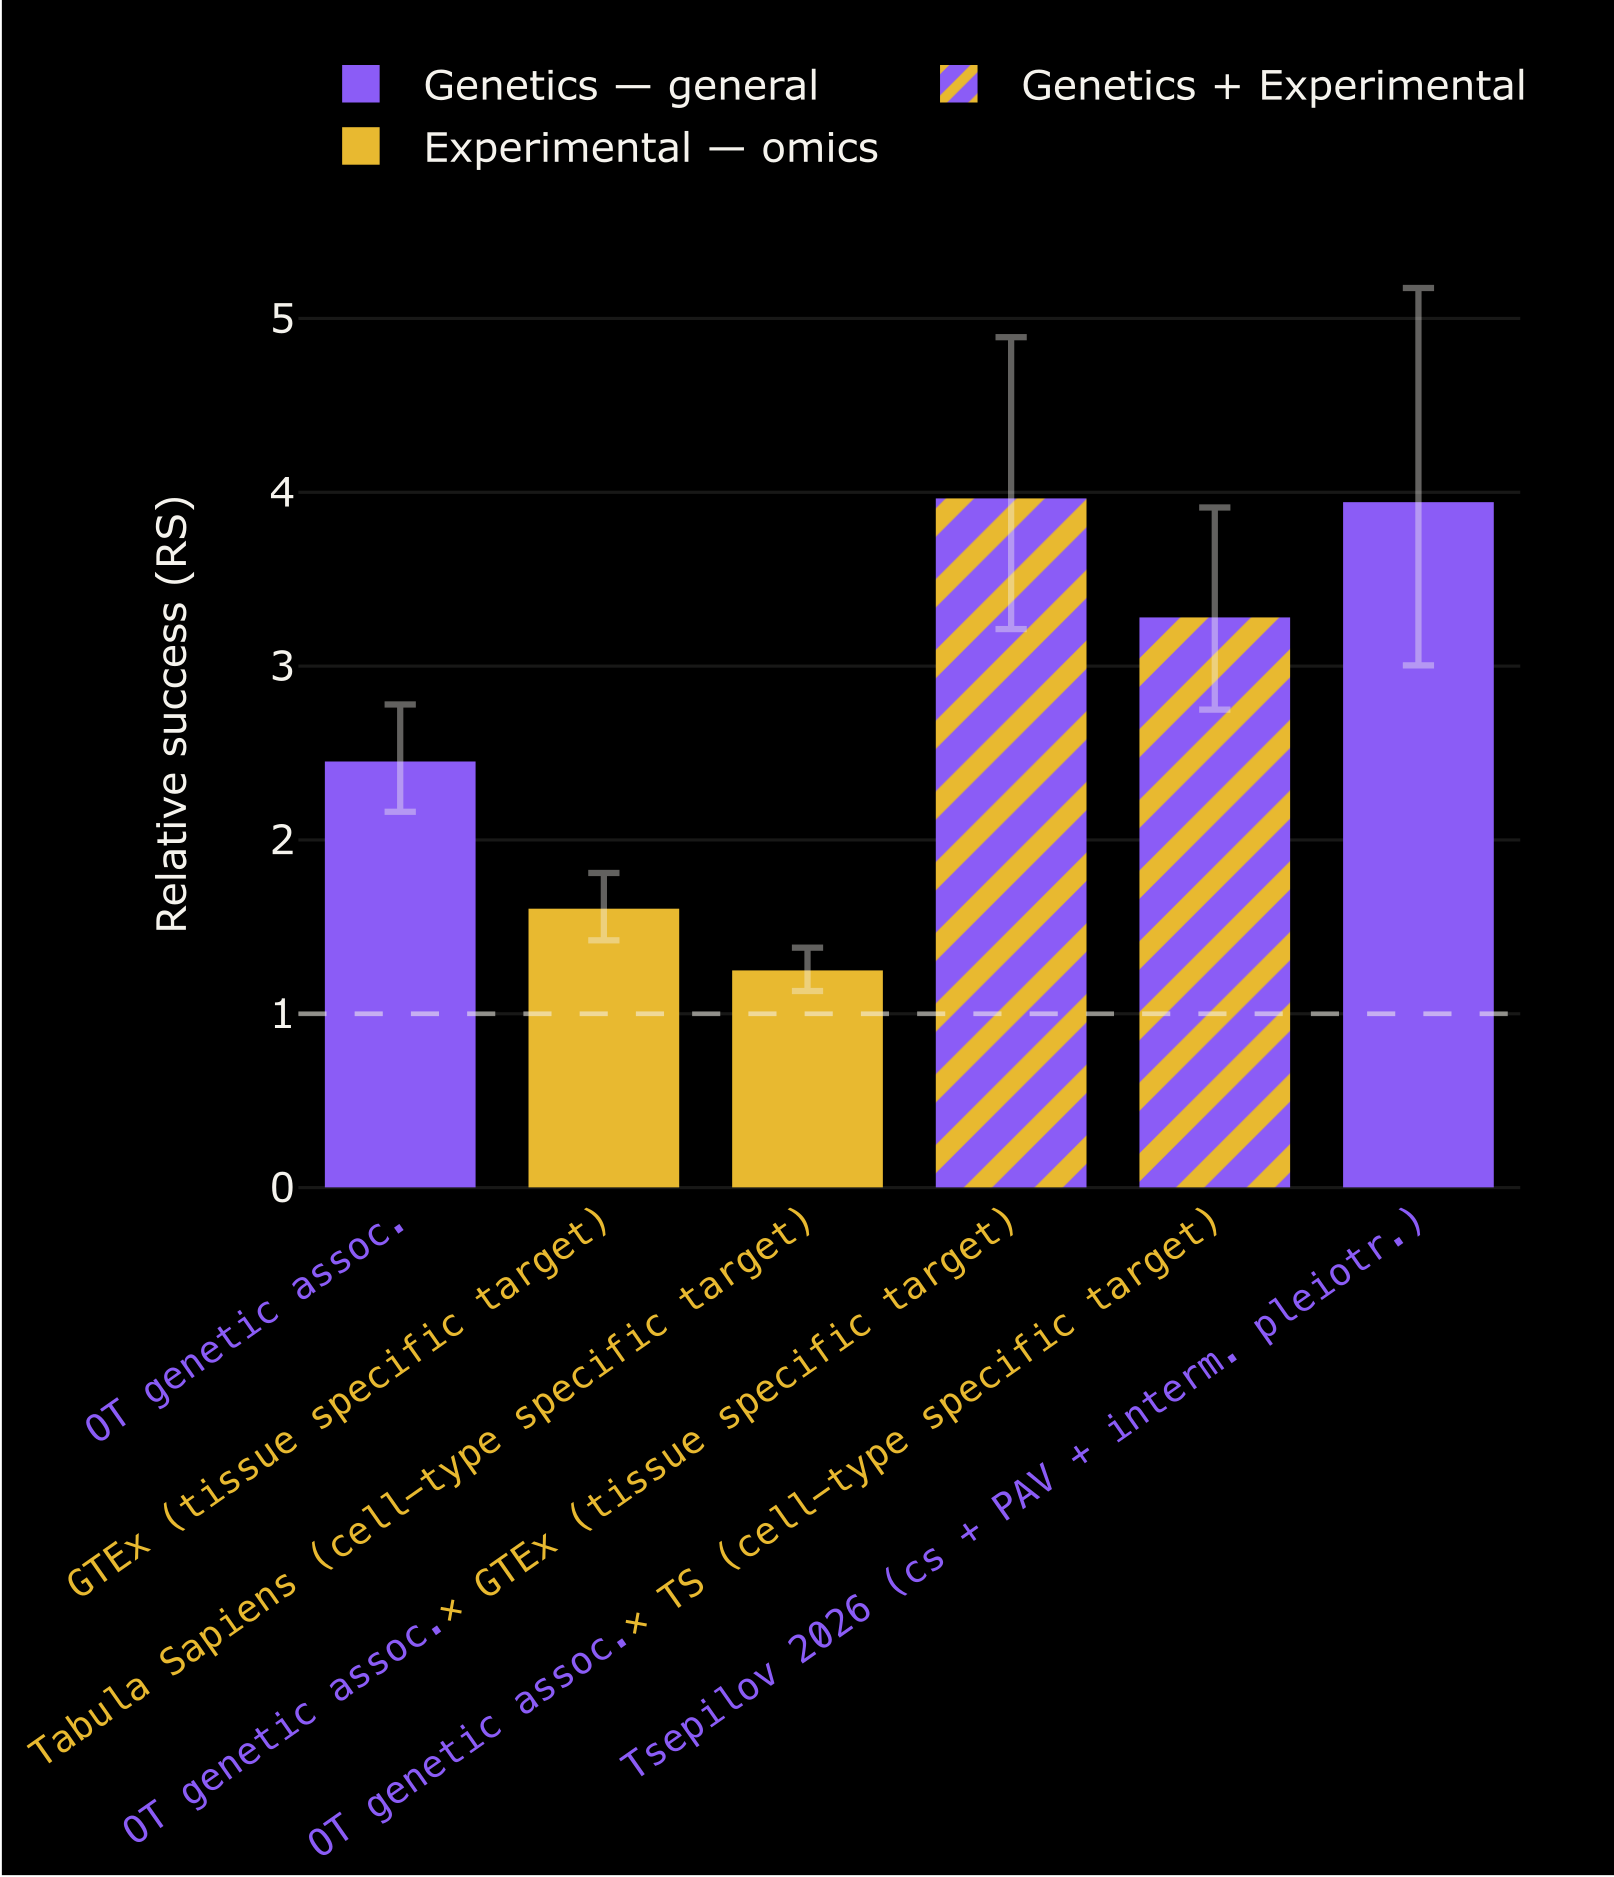
This principle can be freely extended. For instance, combining genetic evidence with tissue / cell type specific expression (Tabula Sapiens6 and GTEx respectively7), boosts RS from 2.45 to 3.28 with Tabula Sapiens and 3.96 with GTEx. A simple combination of two evidence sources matches the OpenTarget preprint’s performance while also surfacing a larger set of programs.
Importantly, the combinations shown here are specific and hypothesis driven. Training models requires more careful engineering to ensure resulting selectors will generalize.8 This is an area we’re actively working on and will share more about in future!
Underwriting biology
Quantifying the relative success is one of the core evals we run at Pheiron whenever we assess new data assets and evidence sources. It is how we decide what to trust and what to further diligence.
It’s important to note that the Relative Success metric has limitations. A backtest is not prospective validation. The label set is sparse as the number of historical programs is limited. For us the Relative Success metric is a starting point, a foundation for further evaluation: it helps us to understand how critical information is distributed over data and evidence sources and allows us to formalize intuitions around what matters.
We believe that through consistent quantification of what matters, we can build a world where we develop drugs not by artisanship and luck but by rational exploitation of calibrated probabilistic landscapes.
Understanding the distribution of critical information is what ultimately allows us to engineer alpha and underwrite biology risk.
The beauty of biology lies in its complexity. Most things simply have not been tried. Within this uncharted space of all possible programs and development paths, the next GLP-1R, the next PCSK9 wait to be discovered.
But some paths are more likely to work than others, and a system that underwrites biology can seek those paths out on purpose. This is the future we’re building!
Bender, A. & Cortés-Ciriano, I. Artificial intelligence in drug discovery: what is realistic, what are illusions? Part 1: Ways to make an impact, and why we are not there yet. Drug Discov. Today (2021)
We wrote about our conviction and why we do this before: https://www.pheiron.com/500-years
Minikel, E. V., Painter, J. L., Dong, C. C. & Nelson, M. R. Refining the impact of genetic evidence on clinical success. Nature 629, 624–629 (2024).
Duffy, Á. et al. Tissue-specific genetic features inform prediction of drug side effects in clinical trials. Sci. Adv. 6, eabb6242 (2020).
Tsepilov, Y. A. et al. The Human Pleiotropic Map of GWAS Associations and Therapeutic Implications. 2026.04.28.721048 Preprint at https://doi.org/10.64898/2026.04.28.721048 (2026).
Consortium, T. T. S. & Quake, S. R. Tabula Sapiens reveals transcription factor expression, senescence effects, and sex-specific features in cell types from 28 human organs and tissues. 2024.12.03.626516 Preprint at https://doi.org/10.1101/2024.12.03.626516 (2025).
GTEx Portal. https://gtexportal.org/home/.
This is an area we’re actively working on, reach out if this is something you think about!